A trace tracks the progression of a single user request as it is handled by other services that make up an application.
Each unit work is called a span in a trace. Spans include metadata about the work, including the time spent in the step (latency) and status. You can use tracing to debug errors and latency issues of your application.
Spans
A trace is a tree of spans.
A span is the unit of work represented in a trace. A span may represent a HTTP request, an RPC, a server handler, a database query or a section customly marked in user code.
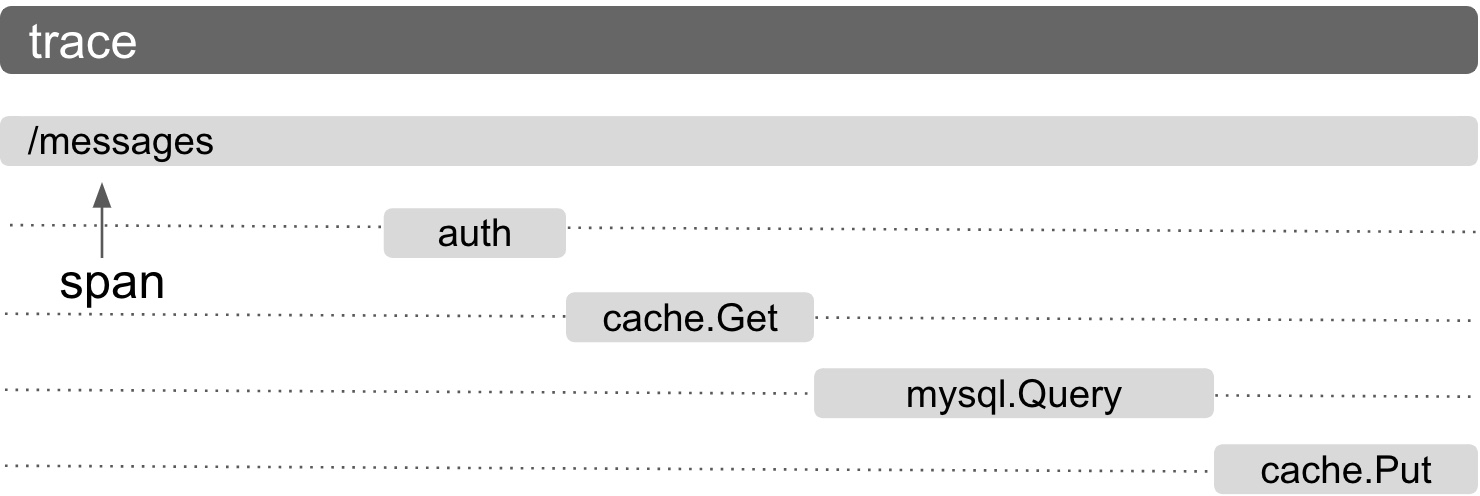
Above, you see a trace with various spans. In order to respond
to /messages, several other internal requests are made. First,
we are checking if the user is authenticated, we are trying to
get the results from the cache. It is a cache miss, hence we
query the database for the results, we cache the results back,
and respond back to the user.
There are two types of spans:
- Root span: Root spans don’t have a parent span. They are the
first span.
/messagesspan above is a root span. - Child span: Child spans have an existing span as their parent.
Spans are identified with an ID and are associated to a trace. These identifiers and options byte together are called span context. Inside the same process, span context is propagated in a context object. When crossing process boundaries, it is serialized into protocol headers. The receiving end can read the span context and create child spans.
Name
Span names represent what span does. Span names should be statistically meaningful. Most tracing backend and analysis tools use span names to auto generate reports for the represented work.
Examples of span names:
- “cache.Get” represents the Get method of the cache service.
- ”/messages” represents the messages web page.
- ”/api/user/(\d+)” represents the user detail pages.
Status
Status represents the current state of the span. It is represented by a canonical status code which maps onto a predefined set of error values and an optional string message.
Status allows tracing visualization tools to highlight unsuccessful spans and helps tracing users to debug errors.
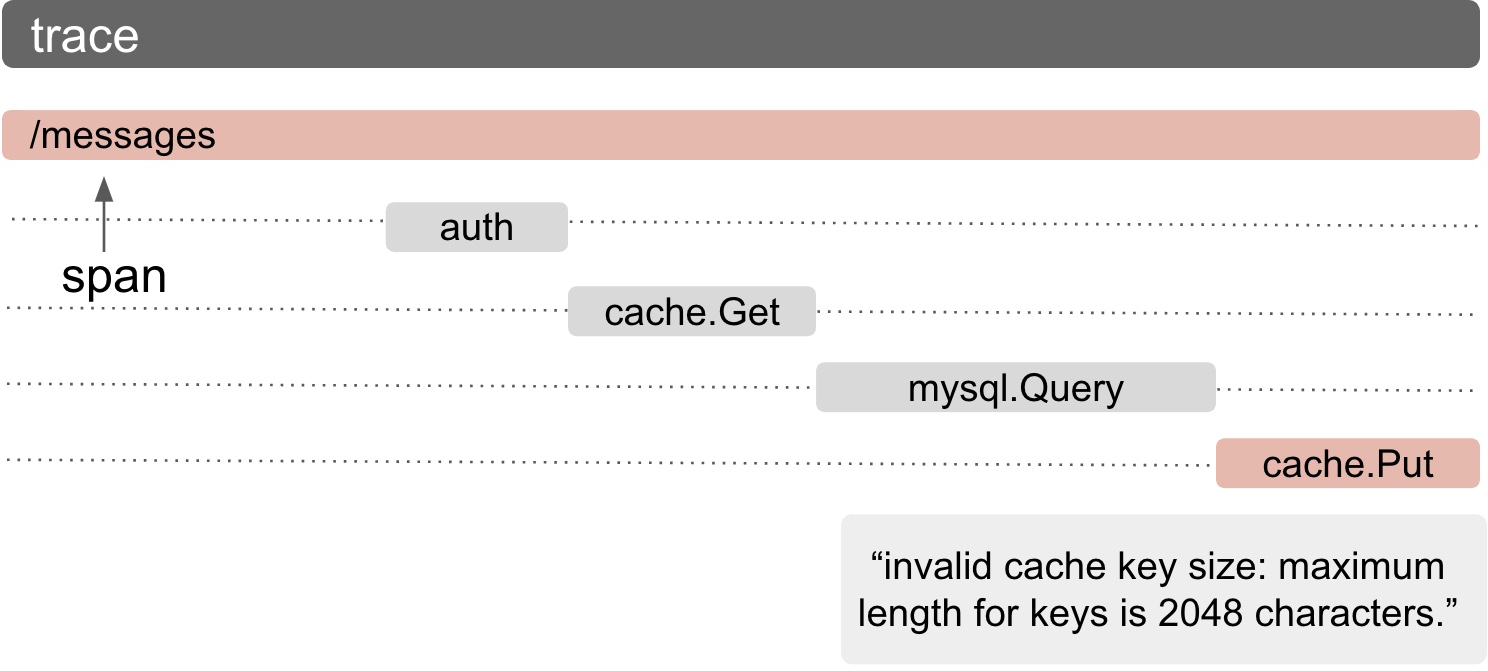
Above, you can see cache.Put is errored because of the
violation of the key size limit. As a result of this error,
/messages request responded with an error to the user.
Annotations
Annotations are timestamped strings with optional attributes. Annotations are used like log lines, but the log is per-Span.
Example annotations:
- 0.001s Evaluating database failover rules.
- 0.002s Failover replica selected. attributes:{replica:ab_001 zone:xy}
- 0.006s Response received.
- 0.007s Response requires additional lookups. attributes:{fanout:4}
Annotations provide rich details to debug problems in the scope of a span.
Attributes
Attributes are additional information that is included in the span which can represent arbitrary data assigned by the user. They are key-value pairs with the key being a string and the value being either a string, boolean, or integer.
Examples of attributes:
- {http_code: 200}
- {zone: “us-central2”}
- {container_id: “replica04ed”}
Attributes can be used to query the tracing data and allow users to filter large volumes of tracing data. For example, you can filter the traces by HTTP status code or availability zone by using the example attributes above.
Sampling
Trace data is often very large in size and is expensive to collect. This is why rather than collecting traces for every request, downsampling is prefered. By default, OpenCensus provides a probabilistic sampler that will trace once in every 10,000 requests.
You can set a custom probablistic sampler, prefer to always sample or not sample at all. There are two ways to set samplers:
- Global sampler: Global sampler is the global default.
- Span sampler: When starting a new span, a custom sampler can be provided. If no custom sampling is provided, global sampler is used. Span samplers are useful if you want to over-sample some sections of your code. For example, a low throughput background service may use a higher sampling rate than a high-load RPC server.
Exporting
Recorded spans will be reported by the registered exporters.
Multiple exporters can be registered to upload the data to various different backends. Users can unregister the exporters if they no longer are needed.
See exporters to learn more.